

Engineering Corner: Unleashing the Power of the AB Suite 6.1 Code Editor
By Fred Heida, Senior Software Engineer, SME System Modeler, Unisys

 Writing and reading code is part of every Agile Business Suite (AB Suite®) developer’s job. That’s why it’s crucial that you understand how the AB Suite Code Editor can help you write that code in the most efficient way possible. In AB Suite 6.1, we redesigned the Code Editor and fully integrated it with Microsoft® Visual Studio®, providing a number of powerful new features.
When writing code, it’s smart to think of yourself as a craftsman. After all, the tools you work with play a big part in determining the quality and efficiency of the code you write. So let’s examine a few useful tools and see how you can activate and even fine-tune them through the Tools>Options>Text Editor dialog.
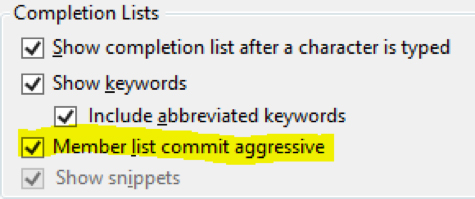
Commit Aggressive
Auto-completion just got faster. Part of Intellisense, this option commits the selected suggestion with one of the special characters that appear at the end of your selection: {}[]().,:=-+*\&<>. This is very handy for qualified attributes, arrays, and methods.
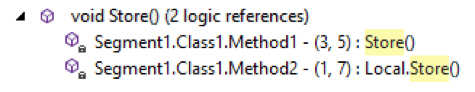
Find All References
Not new to AB Suite, but recently enhanced to work with members of the framework. For example, persistent classes would extensively use the built-in Store() method. Now you can ask where this method is used on all instances of this class. For those unfamiliar with this option, it’s part of the right-click popup menu and acts on the selected text.
Peek to Definition
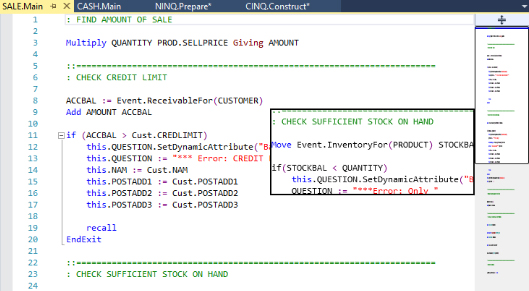
Need to take a quick look at another method? By using Peek Definition, located in the context menu, you can view and edit the invoked method without navigating away from your current location. It’s a concept similar to expanding an Insert statement, but with the added benefit of working with the full Code Editor experience. The image below shows the Peek Definition window for the method named PopulateScreen().
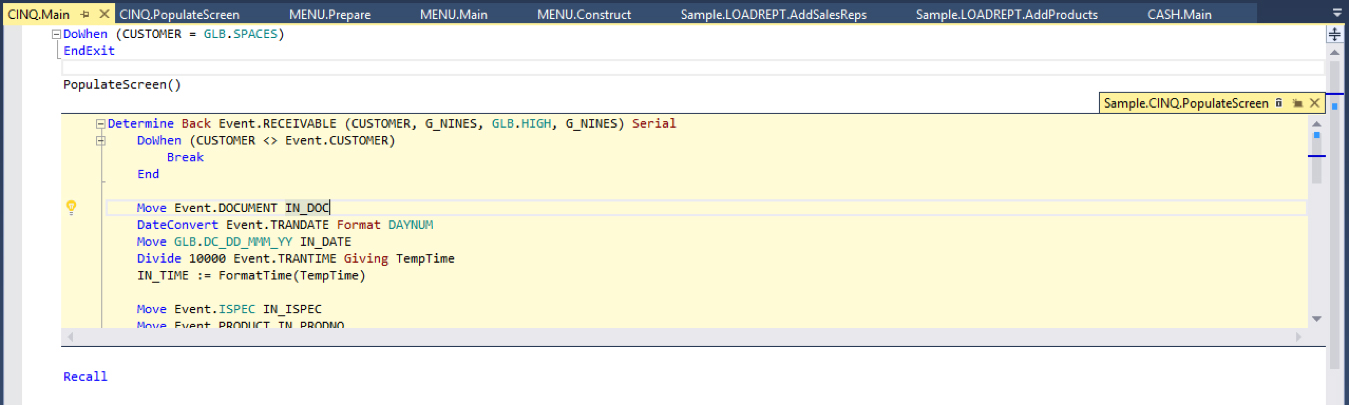
The best part is, you’re not limited to one peek per logic. You can have multiple peeks all active for the same logic – and even drill down to peeks within peeks.
Format Document
Distracted by different coding styles throughout a method – be it commands defined in mixed case or a mashup of abbreviated and standard naming conventions? Without consistency, the logic becomes harder to read and keep clear of mistakes.
If this happens, use the Format Document option, one of the advanced settings in the Edit menu, to automatically change the logic to conform to the Command Style settings. This will apply to any new logic, including logic you copy and paste.
Keep Track of the Changes
Want to see what lines of code you changed since the Code Editor opened? The Code Editor keeps track for you: a yellow bar on the left-hand margin shows changes made since the document was opened, but not saved. It will turn green after you save your changes.
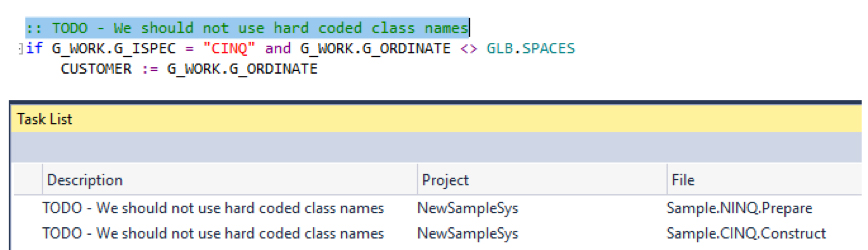
Task List
It can be convenient to include “ToDos” in your comments – but even easier to forget to come back to them. Now you can use the Task List in the View menu to keep track of these coding reminders.
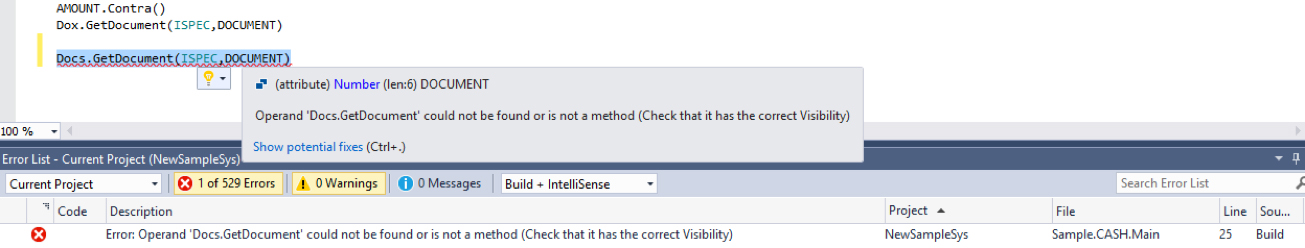
Dynamic Validation
Mistakes happen, and catching them early can save time. With Dynamic validation turned on, a red squiggle will appear as soon as you make a coding mistake, alerting you to errors in real time. This way, you won’t have to wait until validation to discover the error.
If you hover over the squiggle, you’ll see additional information about the error. A light bulb may also appear with suggestions on how to fix it. The Editor provides suggestions for undefined variables and automatically creates them for you, with the correct type, of course. Alternatively, it shows names that are a close match in case of a typo.
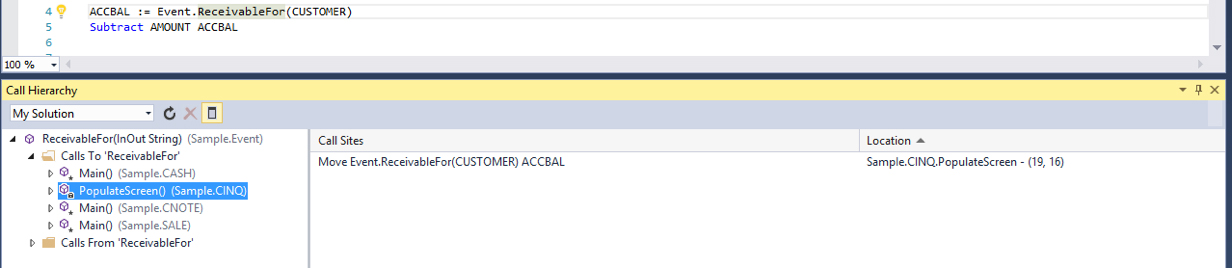
Call Hierarchy
The Call Hierarchy view enables you to navigate through your code showing all calls to and from your selected method. Similar to the call stack in the Debugger, this is a design-time view of all possible execution paths. You can invoke it in the View Call Hierarchy context menu to see the methods that call, and are called by, the highlighted method.
Scroll Bar Map Mode
The scroll bar has two modes: The default bar mode, which only displays annotation indicators on the scroll bar, and map mode. Map mode represents the lines of code on the scroll bar, and when you click a location on the scroll bar, the cursor moves to that location in the code.
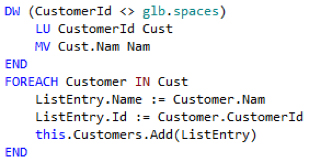
Syntax Coloring
Want to see if a token is an attribute and not a variable, or method and not a profile? With the new Code Editor, you can set a different color for every element kind used in the code, including variables, attributes, methods, and profiles. This way, you can distinguish between them as you read your code.
The features described in this article are but a small sampling of the many new and exciting capabilities in the latest version of the Code Editor. We encourage you to try them all today! And if you have questions, suggestions, or comments, please reach out to fred.heida@unisys.com.
| Share this article: |