

Consolidated Traffic Console: Data Center Monitoring Made Easier

You know how important it is to maintain and maximize the availability of the business-critical systems your organization, its partners, and external consumers rely on day in, day out. The trouble is, as your IT environment encompasses more connections, processes, and technologies, monitoring everything becomes exponentially more complicated, costly, and time-consuming.
Fortunately, though, we have a new service designed to alleviate these complexities and help your data center operate with greater efficiency and reliability: Consolidated Traffic Console (CTC).
A customized data center automation offering based around Unisys Operations Sentinel, CTC leverages our experience and best practices – along with the lessons learned from working closely with clients around the world – to extend and enhance the product’s existing capabilities in ways that help you accomplish your data center monitoring objectives.
How It Works
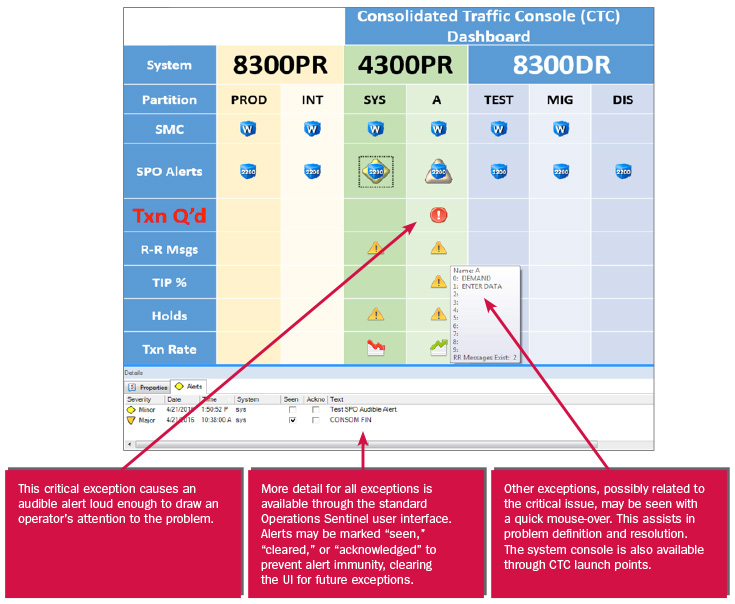
The CTC Dashboard provides a customized Topology View that takes the key performance indicators (KPIs) captured by Operations Sentinel and filters them through a client-centric data center operations context.
Standard Operations Sentinel views can still be shown alongside, or within, CTC. Audible alerting is available as well. Together, this automation package helps to reduce risk and improve the management of ClearPath® MCP and OS 2200, UNIX®, and Linux® environments, as well as data replication solutions and virtual tape systems.
With the help of CTC, you’ll be able to increase the operational quality of your most important systems. Moreover, knowing that a crucial system value, such as queued transactions, is exceeding an expected threshold eliminates the need for your operators to “screen scrape” each system console, helping to reduce costs. More importantly, it enhances awareness, enabling them to take concrete steps toward identifying and resolving a problem before it becomes a major issue.
CTC in Action
Below are a few examples of CTC running at MCP and OS 2200 client sites. The annotations describe the specific CTC Dashboard use case captured on each image.
The solution described earlier in this article was recently implemented at a large European bank.
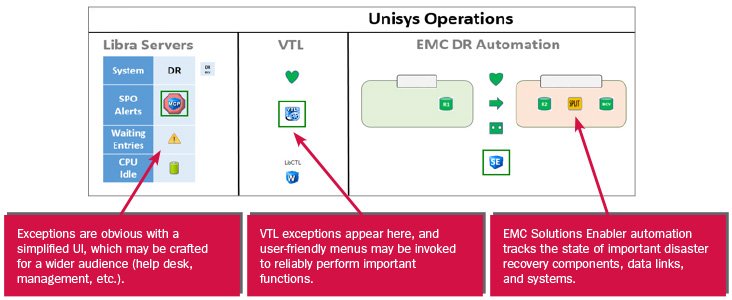
This example illustrates a simplified display that integrates with EMC® Solutions Enabler to monitor and automate EMC SRDF® and TimeFinder® operations, as well as a virtual tape library (VTL) from Dynamic Solutions International®.
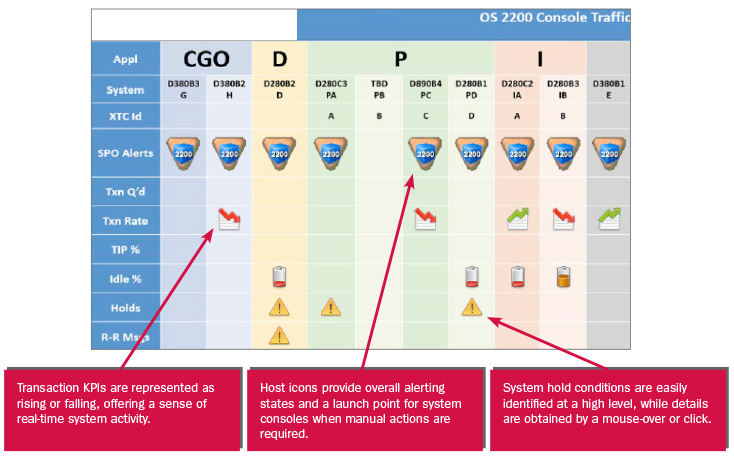
This final example shows how a large client created a customized CTC dashboard to consolidate console traffic for 16 OS 2200 systems in a way that makes intuitive sense to its data center operators.
Ready to Get Started?
While every data center is different, Operations Sentinel is powerful and flexible enough to meet nearly any challenge. If members of your team have sufficient Operations Sentinel knowledge, you could implement CTC yourself. However, we recommend working together on a customized automation consulting service engagement that combines our prior experiences with industry best practices to deliver the highest ROI automation deliverables in the shortest time possible.
Please contact Jim Malnati, Rob Jamieson, or your Unisys sales representative for more information regarding these and other exciting data center automation services.
| Share this article: |
 |
 |
 |